Météo Climat France
358 indexable pages, a map animated over 72 time steps — and not a single line of framework.
- Year
- 2026
- Design & build
- 6 weeks
- Stack
- JavaScript · MapLibre · HTML/CSS · Vercel
- Information architecture
- Interface design
- Development
- Mapping
- Programmatic SEO
- Scientific writing
Product published by KAYZEN, served at a Vercel preview address pending its final domain.

- indexable pages180 towns · 141 climate pages · 16 explainers · 12 maps
- 358
- interpolated grid points
- 247
- animated hourly time steps
- 72
- mapping API keysMapLibre and IGN base map self-hosted
- 0
What needed solving.
The background
Météo Climat France is a free national weather service published by KAYZEN. It covers three distinct uses from the same database: everyday weather (hour by hour over 48 hours, 10-day trend), climatology (averages and records by station) and agricultural weather (soil temperature and moisture, ET0, water balance, degree days, spraying conditions).
The constraint
Three constraints pulled against each other. The service had to display an animated map of France over 72 hourly time steps — so heavy computation in the browser. It had to remain usable on a phone at the edge of a field, often on 3G. And it had to exist in Google for ultra-local searches such as “météo Vénissieux 69200”, territory held by players established for twenty years.
The response
We resisted the framework reflex. The site is written in vanilla JavaScript, split into eleven modules loaded on demand, with self-hosted MapLibre for the mapping. The budget saved on the runtime was reinvested where it counts: interpolating the 247 grid points, pre-rendering the 358 pages and getting the agronomic vocabulary right.
Every design choice, and the reason for it.
The map as the home page
The first screen is not a search form but the map of France, already rendered, at the current hour. Visitors see their answer before doing anything. Search by town or postcode remains available just below, and the “/” key brings focus back to it from anywhere.
One colour scale per variable
Temperature, precipitation, wind, cloud, pressure, humidity, thunderstorms and UV each have their own ramp, bounded and labelled. None relies on a red-green gradient alone: deuteranopia affects 6% of men, and a poorly chosen weather map becomes unreadable for them.
A time slider that works by keyboard
Left/right arrows to change the hour, Shift + arrows to change the day, Space to play the animation, Home to return to now. The shortcuts are written beneath the slider, not hidden away in a help page.
A description in plain words
Below the map, a link — “Text description of the map” — renders in words what the map shows. It is essential for screen readers, and incidentally readable by search engines — for them, a canvas map is an empty image.
A single, self-hosted typeface
Nunito as a variable font served from the site's own domain. No request to Google Fonts: a third-party font on a service consulted daily is a network dependency and a transfer of data abroad without a legal basis.
Project palette
Sky blue
#2E7BB6
Structure, links, headers
Slate
#1F2933
Main text
Wheat
#C9A227
Agriculture section
Alert
#C6413B
Thresholds exceeded, warnings
Type system
Display
Nunito 700
Body text
Nunito 400
A single variable family, self-hosted. Figures use tabular widths: without them, a changing temperature makes the whole column of an hourly table jump.
What's under the bonnet.
- JavaScript
- MapLibre
- HTML/CSS
- Vercel
Vanilla JavaScript, eleven modules
menu, logique, couches, meteo-api, agro, app, climat, comprendre, glossaire, bandeau and the MapLibre vendor bundle. Each page loads only what it needs: a station's climatology page ships neither the agronomy engine nor the radar player.
Self-hosted MapLibre rather than Mapbox
No API key, no per-view billing, no call to a third party on every load. The base map comes from IGN — French public data, consistent with a service that talks about French towns.
Interpolation on a 247-point grid
Public models provide a grid; the interface needs a continuous field. Interpolation and rendering happen in the browser, in one pass per time step, with all 72 time steps cached: the animation stays smooth without calling the API again.
/api/ routes off-limits to robots
robots.txt excludes /api/. Without that, every crawl by a bot would burn through the Open-Meteo quota for nothing — and an exhausted quota means the service is unavailable to real visitors.
Server-side data functions
Calls to the models go through server functions that normalise, cache and bound the responses. The browser never talks directly to the provider: the day the data source changes, the interface does not move.
How the site makes itself findable.
358 URLs, four templates
180 town pages (/meteo/lyon-69001), 141 climatology pages (/climat/…), 16 explainer pages (/comprendre/…) and 12 thematic map pages (/cartes/radar…). Each template answers a different intent; no page is a cosmetic variant of another.
Content specific to each town
Programmatic SEO fails when it duplicates. Each town page carries its coordinates, its altitude, the averages of its reference station and its records — values that genuinely differ from one town to the next.
Three structured data blocks
WebApplication (weather category, declared as free), WebSite with a SearchAction pointing to the real internal search, and FAQPage fed by the questions actually answered on the page.
Internal linking that makes sense
The footer links the sixteen largest cities; each page links to its climatology page, its maps and its glossary. The linking follows the reading journey; it is not a carpet of links.
Consistent sitemap and canonicals
One canonical per page, a sitemap listing exactly the 358 URLs served. A URL missing from the sitemap does not get crawled; a sitemap URL without a page is a soft 404 that drags down the whole domain.
Usable by everyone.
Since June 2025, the European Accessibility Act has required digital accessibility from a large share of online services. We build it in at the design stage rather than retrofitting it.
A map that exists without sight
The text description of the map is not an alt attribute: it is generated content, up to date with the time step displayed, reachable by keyboard and readable by speech synthesis.
Everything by keyboard
Changing layer, town or time step, playing the animation: no interaction requires a mouse. The shortcuts are documented on screen.
Colour ramps tested for colour vision deficiency
Each ramp was simulated for protanopia, deuteranopia and tritanopia. The values remain distinguishable, and the legend always shows the numerical bounds.
What was delivered.
- Home — animated map and search
- /meteo/<town>-<postcode> — 180 town pages
- /climat/<station> — 141 pages of averages and records
- /cartes/<layer> — radar, infrared and visible satellite, lightning, UV…
- /meteo-agricole — soils, ET0, water balance, spraying
- /comprendre — 16 explainer pages and a glossary
- /lune, /contact, legal notice, privacy, terms of use/sale, accessibility
How the project unfolded.
Data model
Choice of public sources (Open-Meteo, IGN), normalising variables, quotas.
Mapping
Grid, interpolation, colour ramps, time slider.
Agriculture section
FAO-56 ET0, P − ET0 balance, degree days, Delta T, Beaufort 3 threshold.
Programmatic SEO
Four templates, generating the 358 pages, sitemap, internal linking.
Compliance
Legal notice, plant-protection regulatory disclaimer, accessibility, GDPR.
What we are often asked.
More of our work
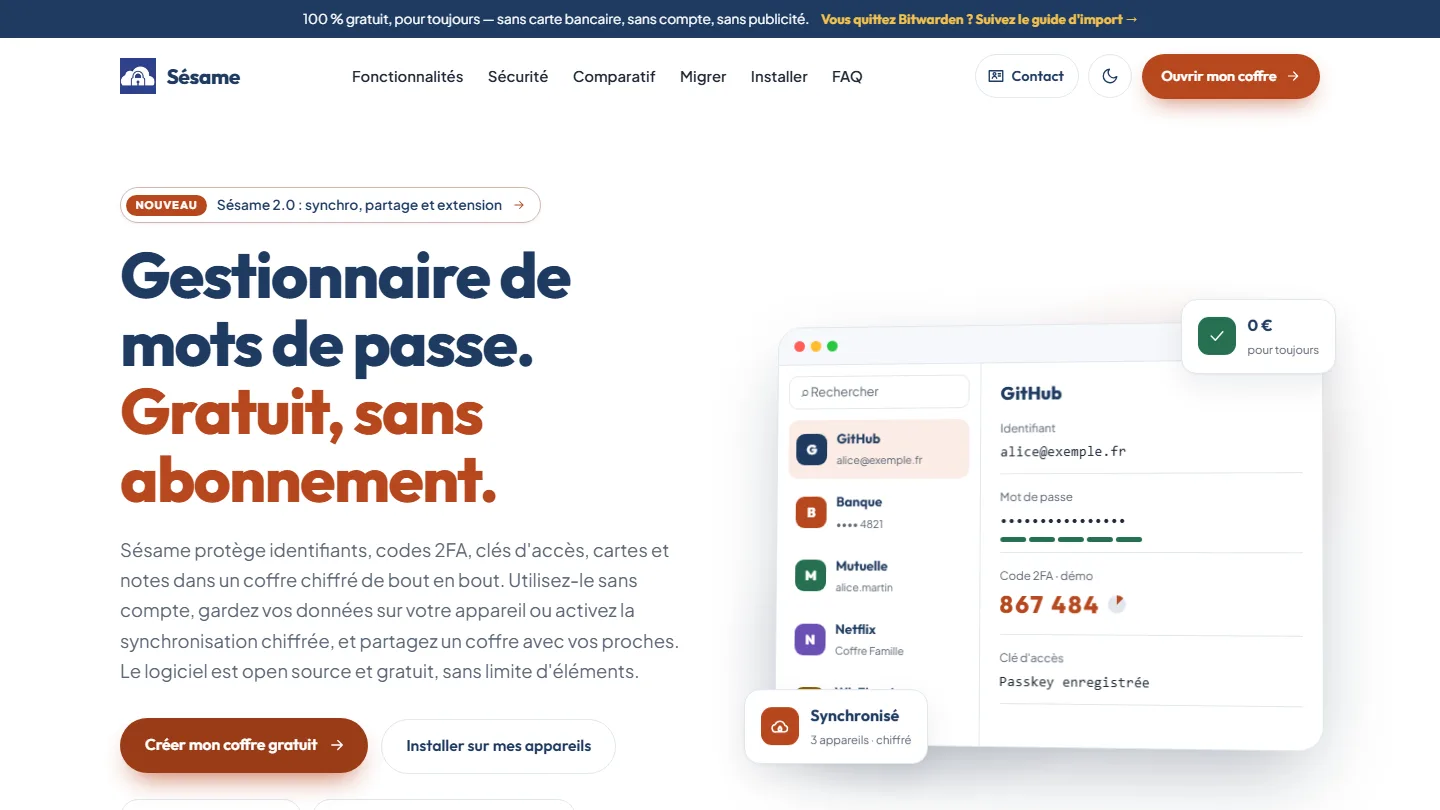 Cybersecurity & cross-platform app
Sésame
A password manager that cannot read your passwords: the architecture was the proof.
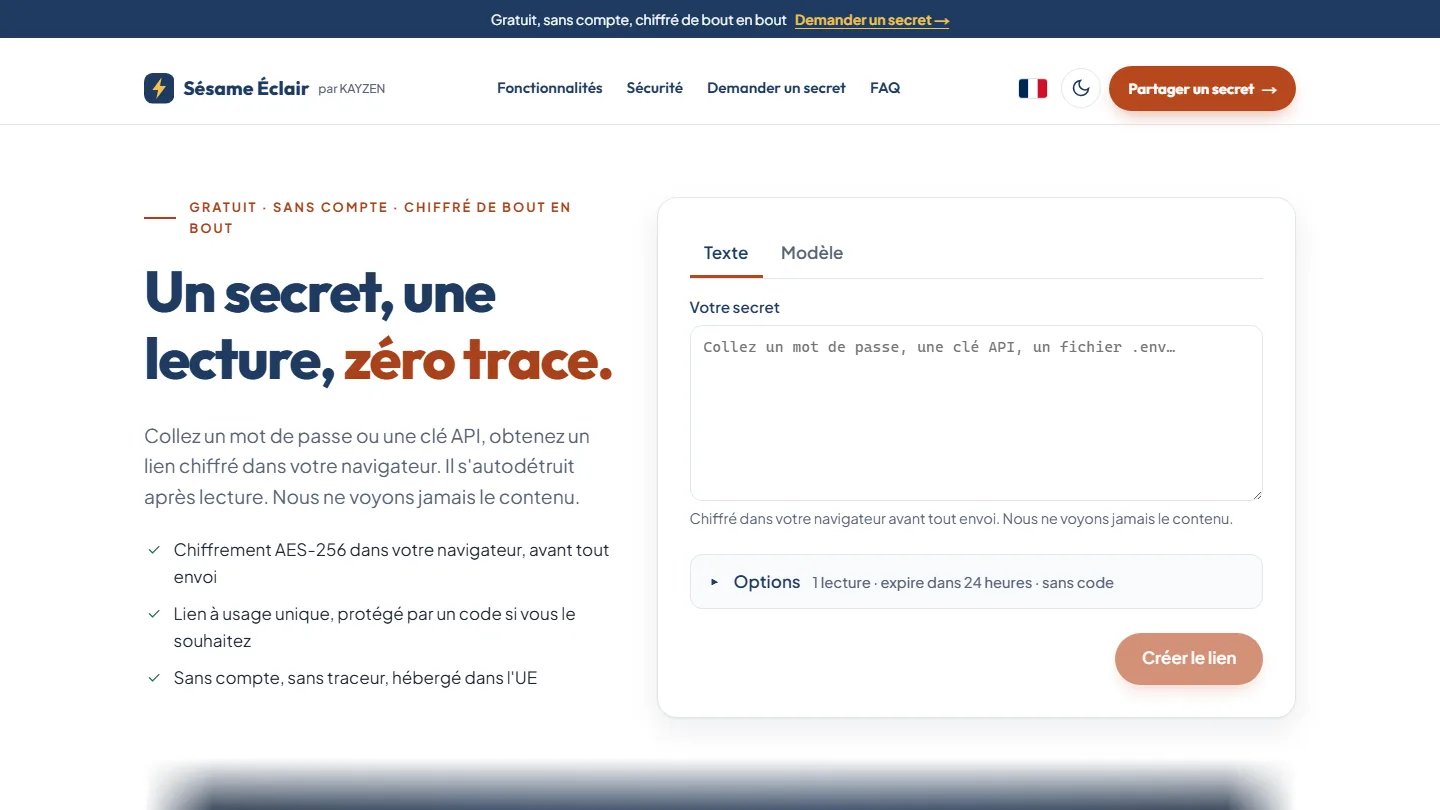 Cybersecurity & web app
Sésame Éclair
One secret, one read, zero trace: the key never leaves the link, the server keeps only an unreadable blob.
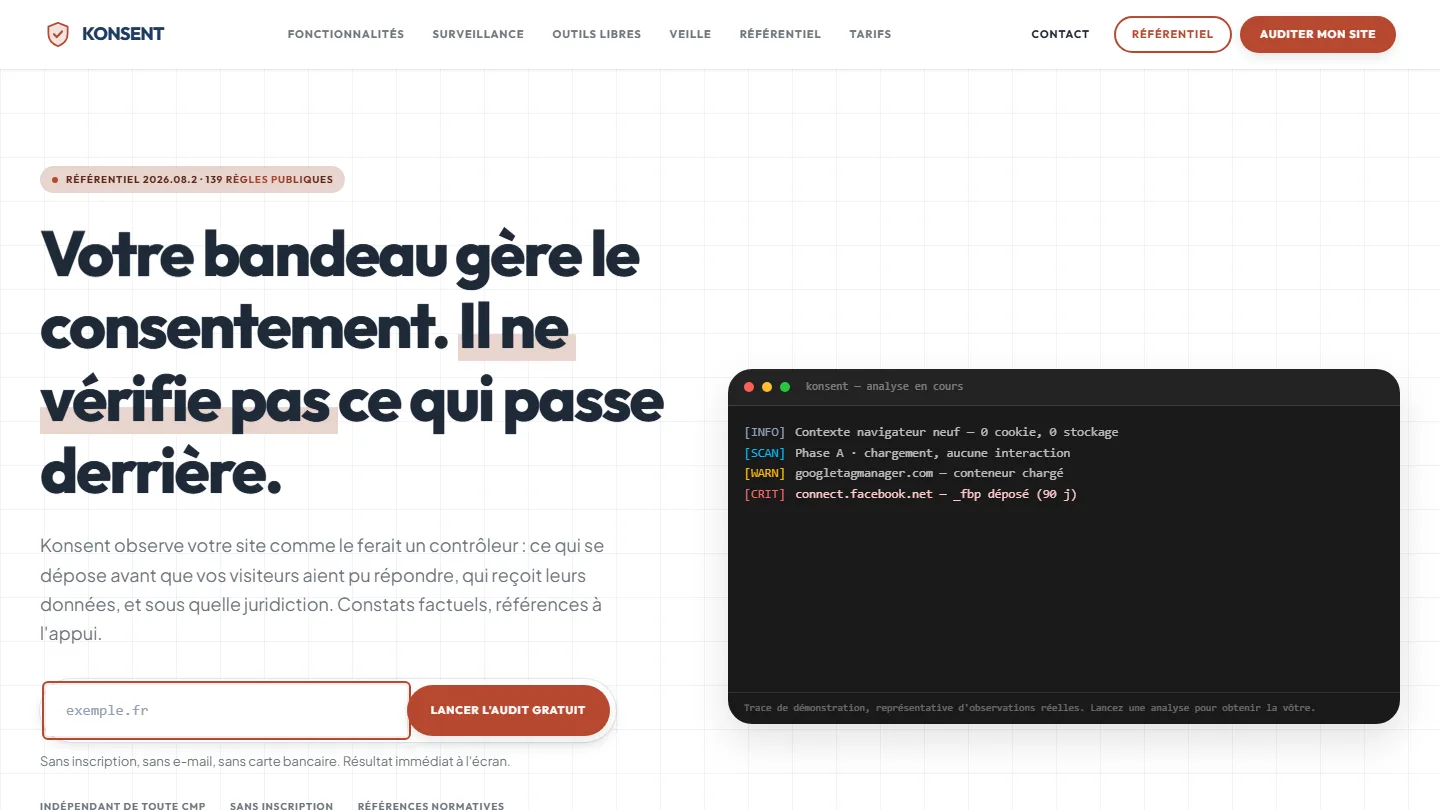 GDPR compliance & SaaS
Konsent by Kayzen
A banner vendor that audits banners is both judge and party: independence was the product.


The same high standards, for your website.
A free audit of your current site, a quote within 24 hours and written reasoning — like the case study you have just read. Pay in three interest-free instalments; local funding schemes checked before you sign.